Becoming a Low Carb Endurance Athlete - Fat Oxidation and Race Fuelling (Part 2)
At the end of the last blog we talked about our paper published in the Journal of Sports Medicine. This paper showed that even at very high levels of fat oxidation, some exogenous carbohydrate is required during Ironman racing for professional and top age-group athletes even when fat adapted. However, upon publication, it was unfortunate that it seems the main message received by many was that Ironman triathletes at high-performance levels must ingest carbohydrate in order to meet their energy requirements, or risk bonking. However, this take-home message was incorrect. In fact, a better way to preserve those precious carbohydrate energy stores, through increasing our capacity to make use of fat as an energy source during exercise.
Our ability to make use of fat as an energy source during exercise can and will change with interventions in diet and training. Generally speaking, fitter athletes will have higher fat oxidation rates for a given speed or power output during exercise. For instance, another paper we published last year reported that the average endurance-trained male, which will generally be your standard weekend warrior, has an average maximum fat oxidation rate of 0.53 grams per minute, which equates to ~5.2 kilocalories of energy, per minute. In contrast, your average sedentary, overweight male might have an average maximum fat oxidation rate of only 0.28 grams per minute or ~2.7 kilocalories per minute.
Therefore, the long and arduous process of getting fitter through training might be expected to bring with it an increased capacity to tap into those effectively infinite fat energy stores during Ironman. However, it’s not guaranteed. And as seen in the example athlete in Figure 2 and 3 in the previous blog, despite being very fit (as indicated by his high maximal aerobic capacity value), his maximal level of fat oxidation is very low.
Another strategy that can be used to drive up our ability to use fat as an energy source during exercise is to lower the carbohydrate content of our diet more generally in what is called fat adaptation. This involves reducing the amount of carbohydrate we eat each day, this ranges as low as 50 g per day to as high as 130 g (depending on the phase of adaptation). In doing so, we encourage the body to adapt in order to use fat instead of carbohydrate, which makes sense given we aren’t giving it much carbohydrate to use as fuel anymore. This translates to exercise and results in large improvements in our ability to access fat as an energy source than through simply training. Fat adapted athletes will have maximum fat oxidation rates at and above 1 gram per minute, or ~9.8 kilocalories per minute.
Our Case Study
So, do you remember our example of a poor fat burner from part 1 of this blog? The good news is, we put him through our EndureIQ “LDT 101” procedure to turn him into a fat-burning machine! This is covered in great detail in our first LDT 101 course. Put simply, Matt Kerr (our case study) started over Christmas 2018 (test 1), and then we tested him again at the end of February 2019. So, all in all, ~8 weeks.
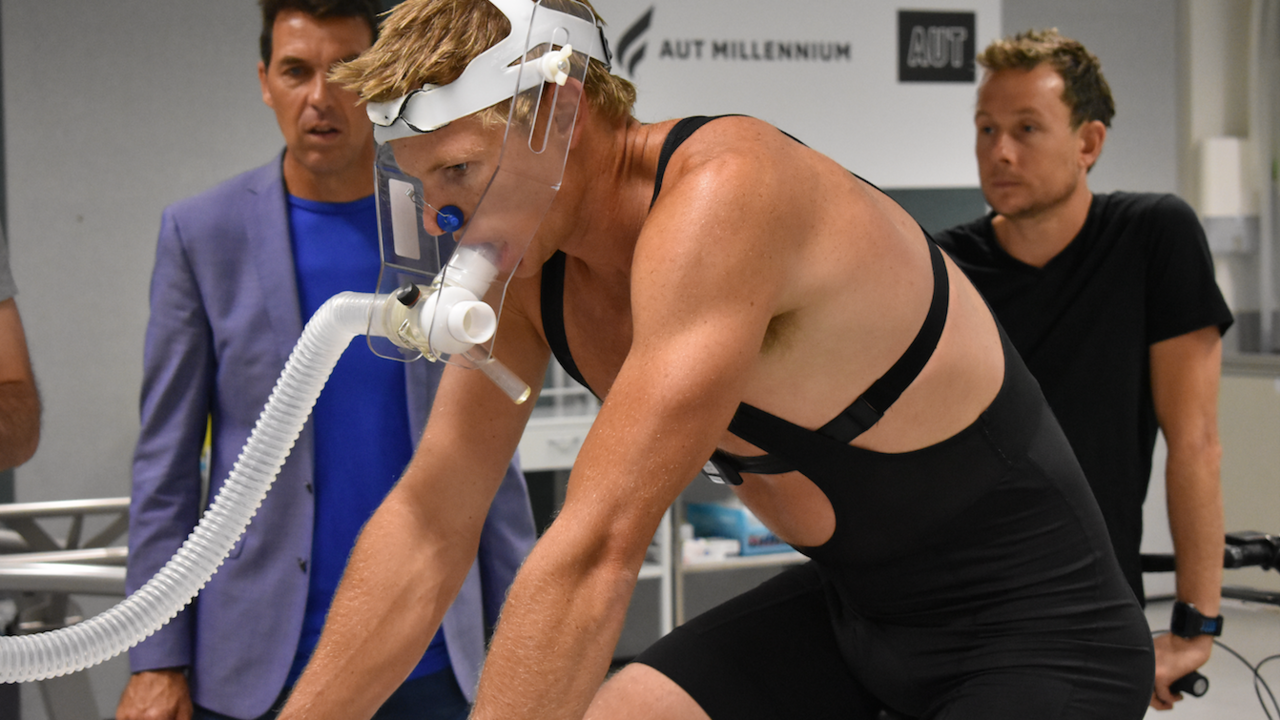 Picture1: Matt undergoing his first ramp test in the lab to assess his “fat-burning”.
To jog your memory, initially, Matt had a maximal fat oxidation rate (MFO) of 0.52 g/min, with a fat max (where this MFO occurs) at 135 w. By following our fat-adaptation guidelines which consisted of a diet low in carbohydrate and high in healthy fat, he shifted his MFO to 1.23 g/min, with a corresponding fat max of 240 w. That’s a BIG shift! Figure 1 nicely displays his increase in intensity throughout the step test (4 min stages, starting 135 w, and finishing >400). The initial cross over point in terms of % carbohydrate and % fat usage originally occurring pretty much immediately at 135 w. Conversely, this happened much later (bold red and blue lines) post-adaptation.
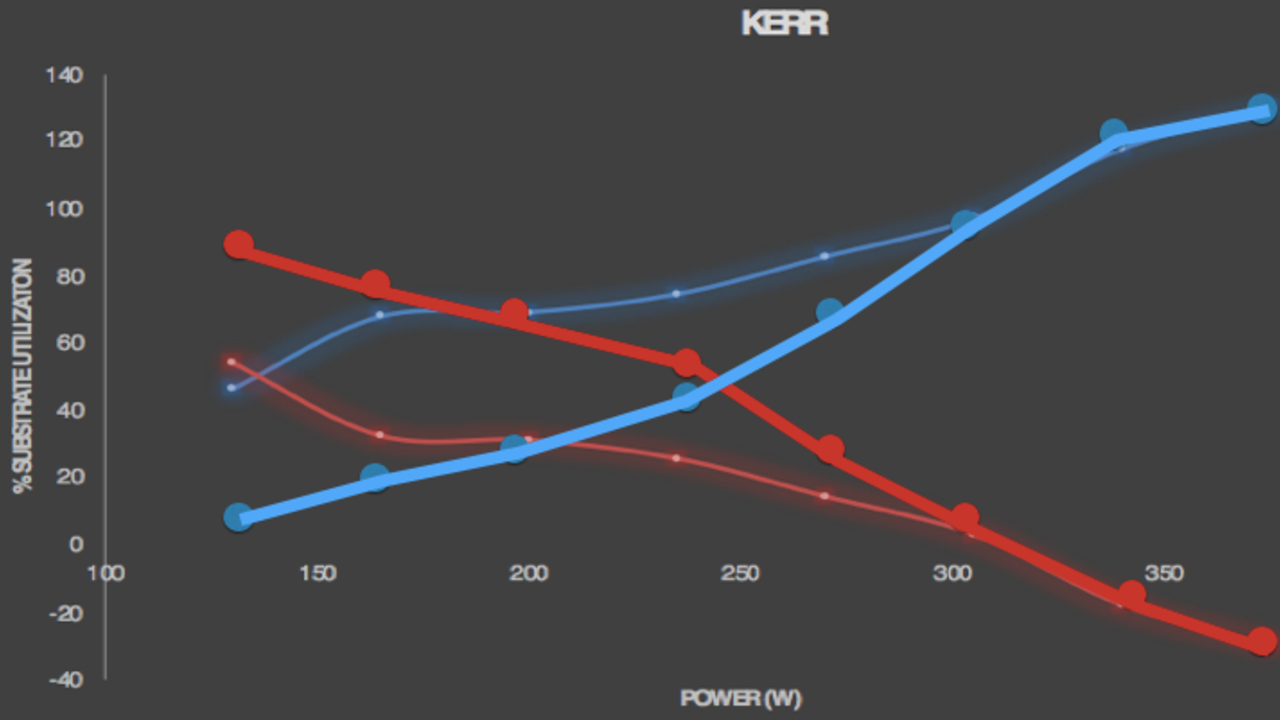 Figure 1: Fat and carbohydrate percentage substrate use pre (thinner lines) and post fat-adaptation protocol (bold lines). Fat usage is represented by the red lines and carbohydrate is represented by the blue lines.
What does this mean?
Matt made this shift as part of the training and preparation for his very first Ironman, which was Ironman New Zealand a couple of weeks ago. Figure 2 shows what this means from an endogenous (stored) carbohydrate standpoint.
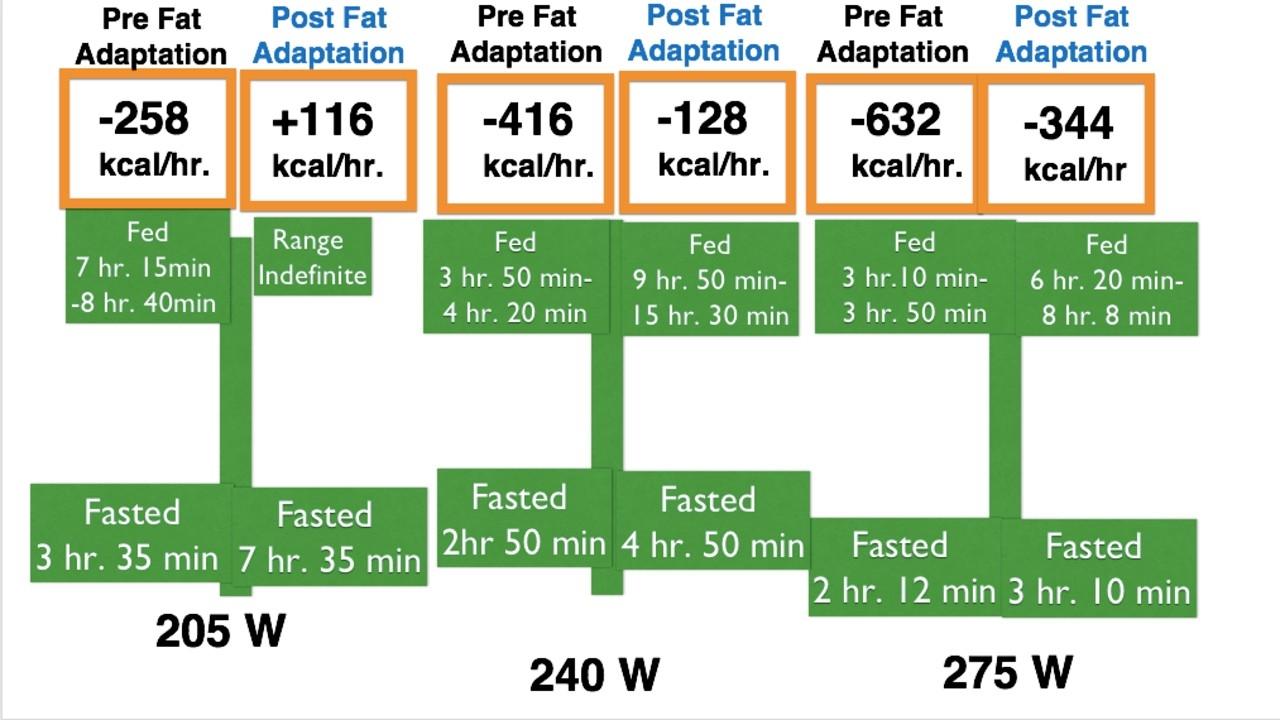
Figure 2: Modelled time to exhaustion pre and post fat adaption. “Feed” refers to the time taken to “hit the wall” when taking in carbohydrate as fuel (lower end 50 g per hour, higher-end 90 g per hour). “Fasted” refers to the time take to “hit the wall”, with zero carbohydrate consumption.
Matt’s aim at Ironman New Zealand was to ride at 240 w (he actually ended up at 255 w). As you can see in Figure 2, if he had not become fat-adapted, and his fat oxidation (FO) remained at 0.41 g/min (which his FO was at 240 w), he would have ended up hitting the wall at about 3 hr 30 min into the bike (how many of us have done that in the past!?). However, with his new MFO of 1.23 g/min. he had more than enough stores, even at modest carbohydrate intakes, to last the entire race. So, at 240 w, originally Matt was losing 416 kcal of carbohydrates an hour. Post adaptation, he was only losing 128 kcal of carbohydrates per hour (228 kcal difference). To put that into perspective, that means Matt was saving 2 standard energy gels per hour!

Picture 2: With his new levels of fat oxidation, Matt saved 2 gels per hour.
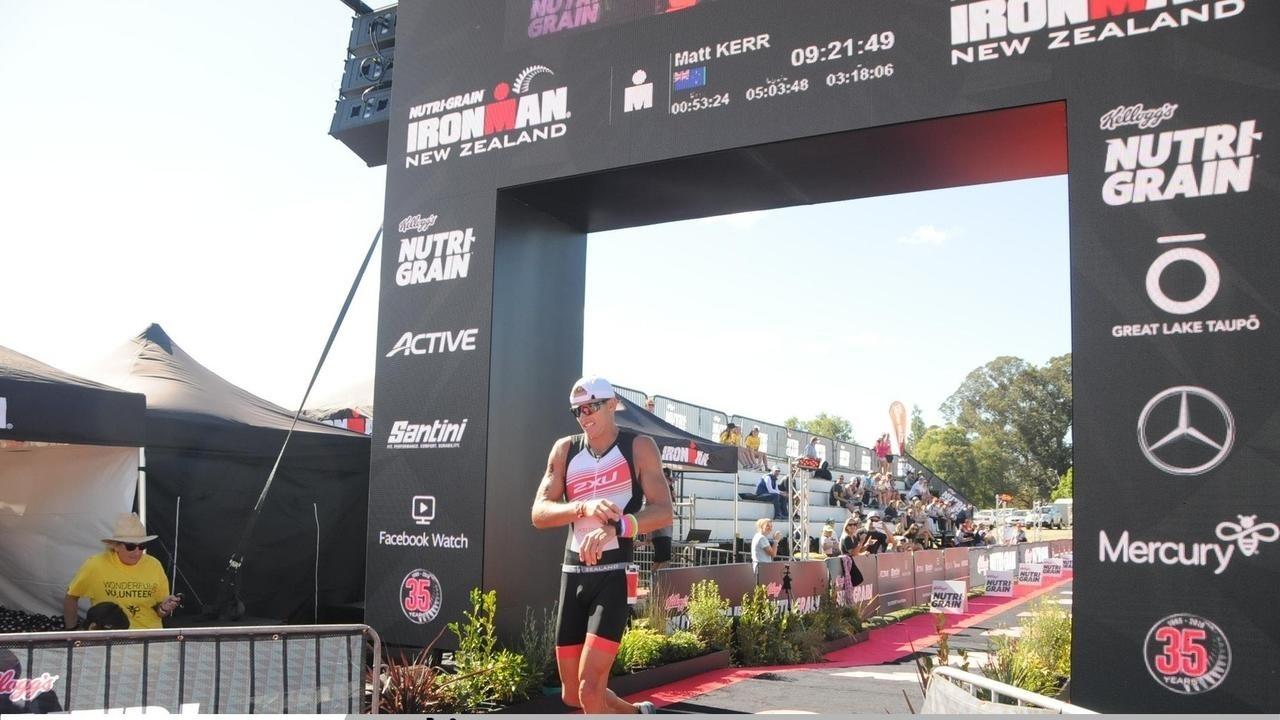
So, what was Matts result in his first Ironman (and in fact his third EVER triathlon!). 9 hr 21 min, and 10th overall in all age-groups. Moreover, he was in 20th position (overall AG) until the last 14 km of the run. He took up a lot of placing in the closing stages. Bravo Matt!!
If you’re keen to learn more about fat-adaptation, be sure to sign-up here to be notified when enrolments are open for our first course Endure IQ Long Distance Triathlon 101 – The Practical Application of Low Carbohydrate Performance for Long Distance Triathlon (Endure IQ LDT101).
 Picture 3: The Fat Adapted Man of the moment Matty Kerr (the one with the medal around his neck). Myself to his right and Prof Grant on his left.
Make the shift!
This combined approach, i.e. racing with carbs but going low-carbohydrate in my typical diet, is also the approach I have taken since 2012, and ultimately to the 2018 World Championships in Kona. Moreover, following such an approach also means we’re generally healthier, with lower systemic inflammation and stable moods. At Endure IQ, we’re all about Performance, Health and Enjoyment, and diet certainly plays a key role when it comes to landing in the model. Just considering training isn’t enough, and just like other key training variables to include in your training program (VO2max, threshold, endurance), this should also be a key consideration.
Watch out for the next blog when I will discuss some fat oxidation and performance shifts of our very own “Keto- Cop” Jan Van Berkel. Indeed, it can work for professionals too!
If you're interested in finding more information on low carbohydrate performance for long distance triathlon, check out our website.
JOIN THE SQUAD
Take charge of your performance with proven training programs and workouts, adjustable to your needs, in the Endure IQ Training Squad.
LIMITED OFFER