Changes in HRV with training intensity and the menstrual cycle: Insights from our big data study

As many of you will know, the application of heart rate variability (HRV) to endurance training is one of my major research interests (6–8), and something I consistently integrate into my coaching practice with elite and amateur triathletes. Daily measurements of HRV upon waking to tell us about our autonomic function; specifically, HRV measured as the square root of the mean squared difference between beat-to-beat intervals (rMSSD) is a measure of parasympathetic nervous system activity. The parasympathetic nervous system is the arm of the autonomic system that slows things like your heart rate down, and therefore suppressed parasympathetic activity, and so suppressed HRV measured as rMSSD, is indicative of a state of stress. This is what makes daily HRV measurements useful for informing the training process; trends in HRV can help us to determine when we might need to back off, and when we can be confident in putting the hammer down. Indeed, using HRV measurements to guide daily training decisions has been shown to have favourable effects on adaptations compared to pre-determined programming (4, 5).
I was therefore very excited to have the opportunity to work with Marco Altini – creator of the HRV app ‘HRV4Training’ that uses the camera on a mobile phone to take daily measures, a technique we previously validated (8) – on a big data study looking at the effects of different acute stressors on HRV. We know that stressors like very high-intensity exercise, poor sleep, and alcohol ingestion leave their mark on HRV, but, through Marco’s unique and enormous data set of HRV4Training app users, we wanted to look at this in free-living conditions. This work has recently been published in the open-access journal Sensors (1) and is free for you to read here.
In this short blog, I will take you through some of the key findings, from over 9 million individual HRV measurements taken by more than 28,000 users of the app. App users have the option of inputting descriptive information, like their age, sex, and body mass index (BMI), as well as information about their previous days, such as alcohol intake, sickness, and basic training parameters. We were therefore able to have a detailed look at the effect of these self-reported characteristics on resting heart rate (RHR) and HRV measured as rMSSD.
What were the main findings?
Below I have listed some of our initial findings. I have expanded on a couple of key effects in the text that follows.
1. RHR was slightly lower in male vs. female app users, with no difference in HRV
2. BMI had small effects on these parameters, with obese app uses having slightly higher RHR and lower HRV
3. HRV decreased with age, but RHR was not affected
4. RHR decreased and HRV increased with greater physical activity levels
5. Alcohol intake and sickness had the negative effects on subsequent RHR and HRV that you would expect; increased next day RHR and decreased HRV
These effects were mostly in line with our expectations, and are a useful source of evidence we can use when working with athletes who have questions about their RHR and HRV parameters. Particularly interesting data I will spend a little more time discussing here are the effects of the menstrual cycle and intensity of the previous day’s training.
Interestingly, RHR and HRV did appear to differ across the menstrual cycle, which suggests the menstrual cycle phase needs to be considered by coaches and athletes interpreting data from the app. Specifically, RHR differed by 1.6% between the follicular and luteal phases, with an increase across the cycle. In line with this, HRV changed by 3.2% between the follicular and the luteal phase, with a decrease across the cycle. This shows, on average, that parasympathetic activity was slightly suppressed in the luteal phase of the menstrual cycle, which is the second half that begins with ovulation and ends with the first day of menstruation. These data are useful for athletes and coaches and should be considered when interpreting RHR and HRV data. But practically speaking, this suggests that recovery from training may be slower during the luteal phase. Therefore, paying particular attention to training intensity distribution and the amount of high-intensity training (i.e. less) may be important during this phase. More research is needed before the scientific community can make generalised recommendations about planning training around the menstrual cycle, particularly given the individuality of cycles, both from person-to-person and cycle-to-cycle. However, these data may be useful for practitioners interpreting shifts in light of other acute stressors.
With regard to how the previous day’s training intensity impacts RHR and HRV, we have data from small, controlled studies conducted previously telling us how training conducted above the first threshold leaves its mark on autonomic function (3, 9), and therefore requires longer subsequent recovery time than moderate-intensity training occurring below the first threshold (10). We thought it was useful to verify and quantify these effects in our large sample, where app users self-report their previous day’s training using the 0-10 perceived exertion scale (2). Training effects were clustered such that we assessed the effects of self-reported rest days, low-intensity days, average intensity days, and high-intensity days on RHR and HRV the subsequent day.
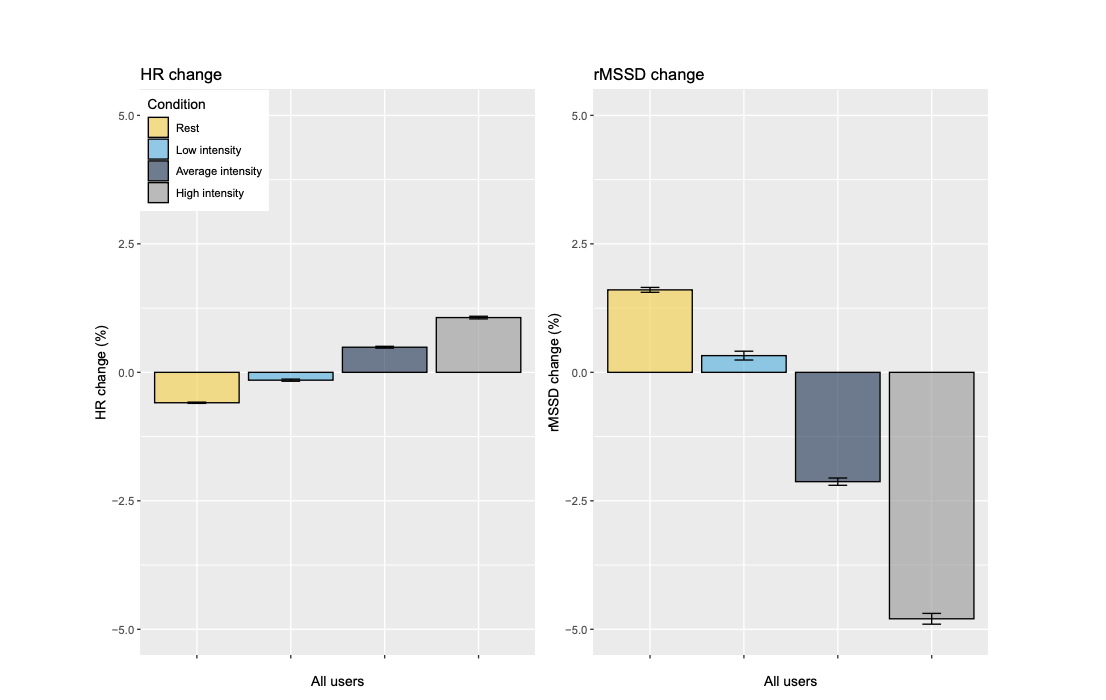
Changes in HRV and RHR in relation to training intensity for all users.
We found that rest and self-reported low-intensity training slightly reduced RHR and increased HRV the next day, with rest having greater effects than low-intensity days. However, when training was of self-reported “average” or “high” intensity, subsequent RHR was increased and HRV was decreased, with the largest effects seen for high-intensity training. This is in line with what we expected to see, and really illustrated to us the value of emphasising low-intensity training in our programmes, and being very targeted with higher intensity work, which does come with a ‘cost’ in terms of physiological recovery. When the bulk of our training week is of low intensity – which, as a physiologist means below that first lactate threshold – we recover quickly and can therefore build a substantial overall training volume. We need to plan and space our specific high-intensity workouts accordingly, ensuring that we are well-recovered when these sessions take place such that they can be performed and absorbed optimally. It was pretty cool to see this dose-response effect borne out in such a massive dataset.
Summary
In summary, then, we identified a number of acute stressors associated with changes in autonomic function – RHR and HRV – the subsequent morning. Specifically, alcohol intake, sickness, and high-intensity exercise suppressed HRV and increased RHR, and HRV was, on average, lower in the luteal compared to the follicular phase of the menstrual cycle. Importantly, rest days and training at a low intensity lowered RHR and increased HRV, indicative of physiological recovery. Moreover, HRV was also much more sensitive to change than RHR when looking at % changes (which most coaches use). The stress has to be quite considerable to see marked changes in RHR. So if you see some big increases in RHR from one day to the next, it might be a good idea to take a rest day. These results are useful for practitioners using daily HRV measurements to guide training decisions, and again emphasise why it’s important to plan and be very specific with regard to when and how frequently we undertake high-intensity workouts within our training week.
If you’re interested in HRV and really we want to understand it can be used to optimize training in yourself, or the athletes you coach do check out our Endure IQ HRV course which covers this very topic. Check it out here.
References
1. Altini M, Plews D. What is behind changes in resting heart rate and heart rate variability? A large-scale analysis of longitudinal measurements acquired in free-living. Sensors 21: 7932, 2021.
2. Borg G. Borg’s range model and scales. Int J Sport Psychol 32: 110–126, 2001.
3. Holt AC, Plews DJ, Oberlin-Brown KT, Merien F, Kilding AE. Cardiac parasympathetic and anaerobic performance recovery after high-intensity exercise in rowers. Int J Sports Physiol Perform 14: 331–338, 2019.
4. Javaloyes A, Sarabia JM, Lamberts RP, Moya-Ramon M. Training prescription guided by heart-rate variability in cycling. Int J Sports Physiol Perform 14: 23–32, 2019. doi: 10.1123/ijspp.2018-0122.
5. Javaloyes A, Sarabia JM, Lamberts RP, Plews DJ, Moya-Ramon M. Training prescription guided by heart-rate variability vs. block periodization in well-trained cyclists. J Strength Cond Res 34: 1511–1518, 2020. doi: 10.1519/JSC.0000000000003337.
6. Plews DJ, Laursen PB, Kilding AE, Buchheit M. Heart rate variability in elite triathletes, is variation in variability the key to effective training? A case comparison. Eur J Appl Physiol 112: 3729–3741, 2012.
7. Plews DJ, Laursen PB, Stanley J, Kilding AE, Buchheit M. Training adaptation and heart rate variability in elite endurance athletes: Opening the door to effective monitoring. Sports Med 43: 773–781, 2013. doi: 10.1007/s40279-013-0071-8.
8. Plews DJ, Scott B, Altini M, Wood M, Kilding AE, Laursen PB. Comparison of heart-rate-variability recording with smartphone photoplethysmography, polar H7 chest strap, and electrocardiography. Int J Sports Physiol Perform 12: 1324–1328, 2017. doi: 10.1123/ijspp.2016-0668.
9. Seiler S, Haugen O, Kuffel E. Autonomic recovery after exercise in trained athletes: Intensity and duration effects. Med Sci Sports Exerc 39: 1366–1373, 2007. doi: 10.1249/mss.0b013e318060f17d.
10. Stanley J, Peake JM, Buchheit M. Cardiac parasympathetic reactivation following exercise: Implications for training prescription. Sports Med 43: 1259–1277, 2013. doi: 10.1007/s40279-013-0083-4.
JOIN THE SQUAD
Take charge of your performance with proven training programs and workouts, adjustable to your needs, in the Endure IQ Training Squad.
LIMITED OFFER