Decoding Power Profiles for Maximum Impact!
In the triathlon and cycling communities, many of us have power meters on our bikes, or smart trainers at home. Power output data can be helpful in pacing efforts and tracking longer term progress. I myself programme many of my training sessions using power output – e.g. 4 x 40 min at 270 W for an Ironman workout – with the target number guided by the laboratory-based physiological profile of the athlete I am working with. For example, in the session above, the target power output is designed to be just above the first lactate threshold, in the so-called heavy intensity domain.
However, not all athletes have regular access to laboratory facilities for physiological profiling assessments and the determination of thresholds. For those athletes, power profiling represents an alternative, field-based method that can be used to provide anchor points in our training programming. Also, power profiling may be used to provide a still-elusive ‘durability’ metric. In this blog, I will set out what power profiling is, and how we as endurance athletes can use it to guide and support our training process.
What is power profiling?
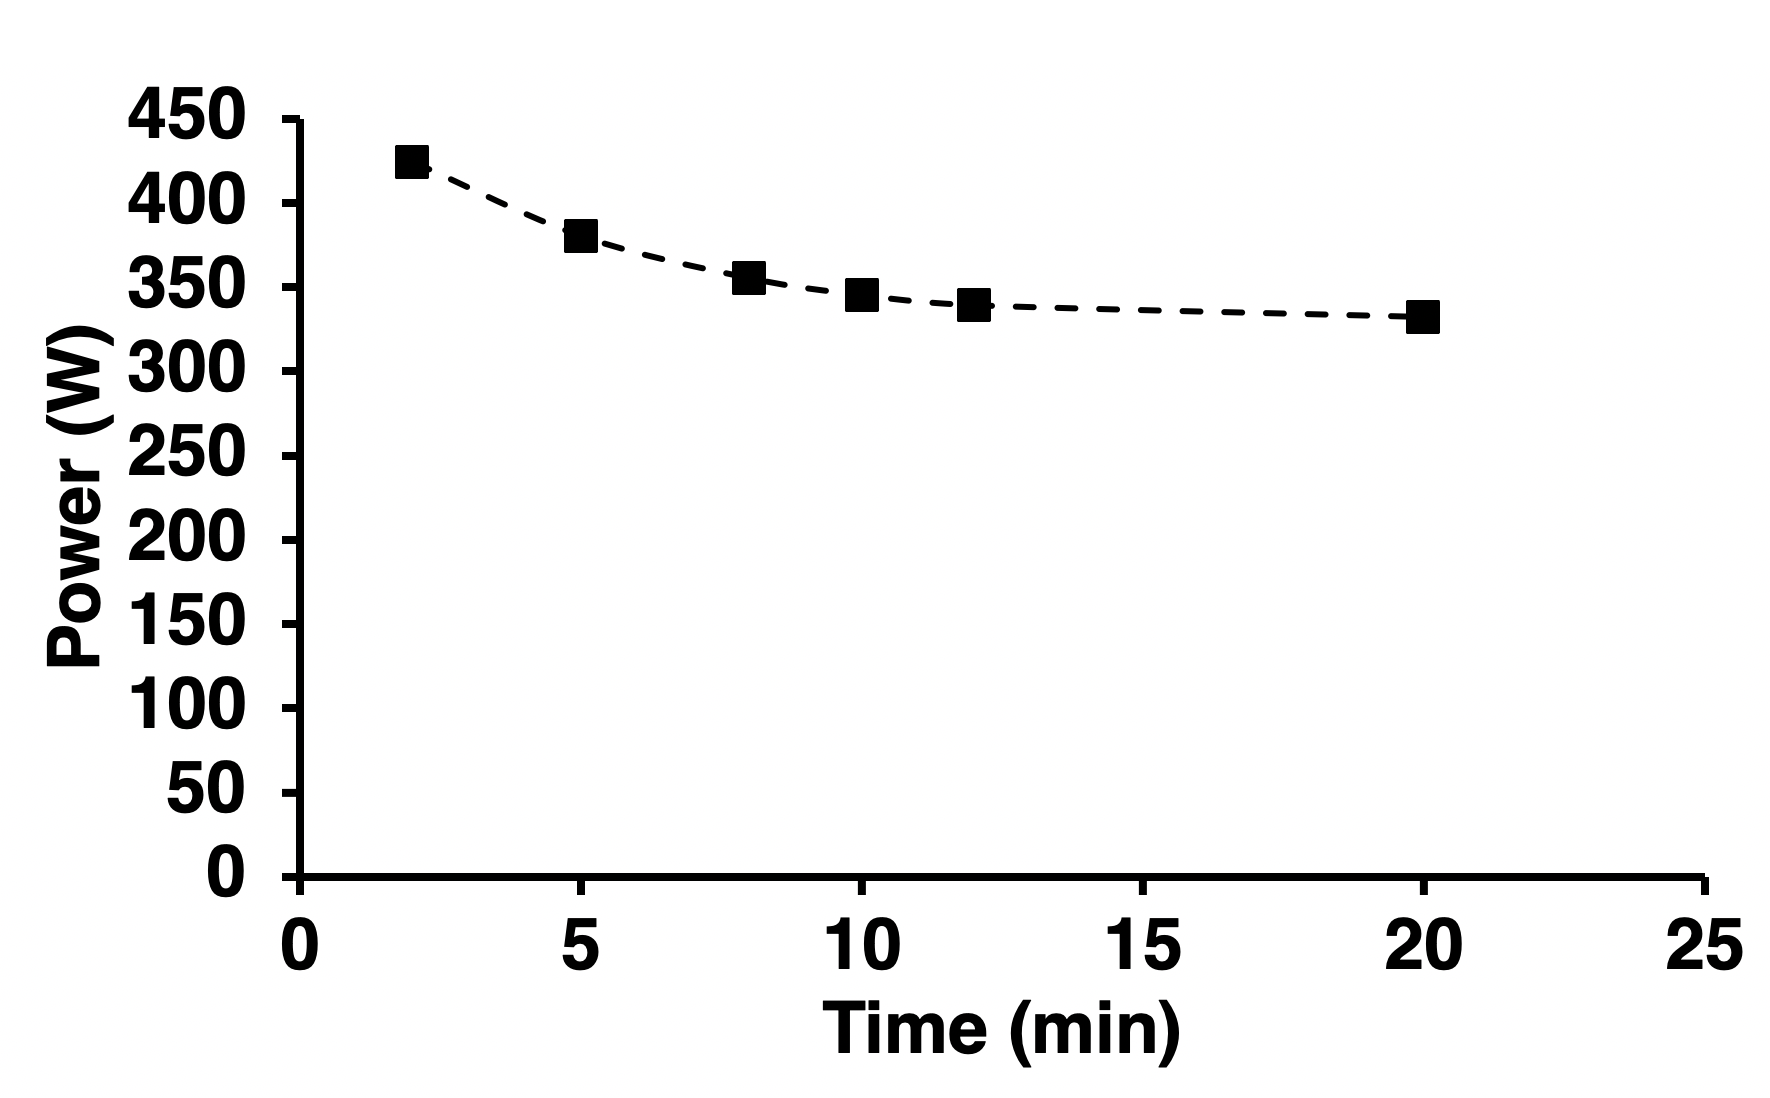
Power profiling refers to quantifying the relationship between the maximum sustainable power output and time for a given athlete (9). Therefore, the power profile is essentially a curve showing an athlete’s best possible performance – expressed as average power output – over different event durations. I’ve plotted an example power profile below.
What can power profiling be used for?
Having an athlete’s power profile can be useful for several reasons. Firstly, and most simply, is that it gives us an idea about their performance; after all, it is a plot of performance data. Therefore, we might use components of the power profile to help guide things like pacing in shorter duration events, as well as in high-intensity interval training sessions. For example, for the athlete shown in the graph above, we might use the curve to suggest that they start out at ~370 W in an event we expect to last ~6 min, or recommend that they aim to complete their 4 x 6 min interval training session at ~90-95% of that.
The power profile can, however, be used for more than that. Using power profile data – maximum power outputs over specific durations – we can derive what’s called the critical power. Critical power refers to the threshold between the heavy and severe intensity domains, or exercise during which we can and can’t achieve steady state values in our metabolism (6). So, if we are working below critical power, values for things like our rate of oxygen consumption (V̇O2), blood lactate concentration, and muscle phosphocreatine (PCr) content will eventually stabilise. Above critical power, these values progressively increase or decrease, never stabilise, until we become fatigued (1, 7, 12). Not being able to stabilise these physiological parameters is one reason why the maximum tolerable duration drops very quickly as soon as we cross critical power and into the severe intensity domain. Using different methods, we try and estimate this same threshold – between heavy and severe, or steady state and non-steady state, exercise – in the laboratory and might refer to it as the second ventilatory threshold (VT2) or lactate turnpoint. These are different methods of trying to estimate the same thing, though they are not always equivalent (5).
Anyway, the important point so far is that critical power is a useful threshold that tells us about an individual athlete’s physiology during exercise. Critical power is traditionally determined, not using complicated physiological measurements, but using the power profile. Critical power is identified as the power output value at which the power profile curve flattens out – the “asymptote” for those more mathematically-minded. If we know an athlete’s critical power, we might use it to for:
- Training programming – when we want a training session to be very hard, critical power is useful as it tells us what the bottom of the severe intensity domain is.
- Monitoring adaptations to training – we typically hope and expect to see critical power rise after a block of solid training.
- Deriving training zones – in the absence of physiological testing in a laboratory, we can use critical power to set training zones and therefore monitor training load.
Recommended approach to power profiling
So, building a power profile can be useful, particularly for athletes who don’t have access to laboratory testing. But how should we do it? Here are my tips:
- You need 3-5 datapoints, or values for power output vs. duration. These all need to be in the severe domain for the curve fitting to work, and so between 2 and 15 min in duration. Ideally, you’ll have one value close to either end. So, you might generate power output values for 3, 8, and 12 min to build your curve with.
- Use specific trials that you programme into your training, rather than scraping best efforts from training and racing (as is done by many training software platforms). That seems onerous, but is worth it if you’re looking to generate an accurate number. If you found your highest power output over exactly 6 min in the last few weeks of data, how do you know if the effort was truly maximal or not? It probably wasn’t, as was discussed in an excellent recent review of power profiling (9). We generally don’t push ourselves to our absolute maximum over very specific durations, unless the session is going to end there and then.
- The trials used to build the power profile are probably best performed on separate days. You can do them on the same day, but you need to be fully recovered between efforts. How long does that take? Some research suggests 30 min between trials is sufficient (8), though I am not convinced that works for all athletes. Consider having a testing week and spreading out your trials.
- Calculating critical power using your 3-5 datapoints can be tricky. I recommend using the brilliant website run by Felipe Mattioni Maturana – com. He has a tab for critical power calculations; you simply enter the average power output achieved in each of your trials, along with their duration, and click “Go!”. Like with most things in exercise physiology, you’ll notice there are multiple ways of calculating critical power, and therefore multiple estimates will pop up when you enter your data – I recommend using the estimate that has the lowest standard error (i.e. the lowest value in the “CP SEE” column), which is a recommendation in line with the literature (11).
Application to durability
For me, one quite exciting potential application of power profiling is in assessing ‘durability’. We have blogged about durability previously, a term we coined in a 2021 paper (10). The physiological thresholds we measure in the laboratory – the lactate threshold (14) and, crucially, critical power (2–4) – decrease over time during prolonged exercise. So, if your critical power when ‘fresh’ is 330 W, after three hours in the saddle it might be down by 40 W to only 290 W. Durability refers to how resilient we are to the effects of prolonged exercise on our physiology; so, a more durable athlete might instead see their critical power fall by only 10 W from 330 W to 320 W over that timeframe.
How we assess durability is still a bit of an open question (something we are currently working on in our lab). We have for example conducted traditional profiling assessments before and after a long ride, and looked at how much things degrade over time (14). Power profiling may provide a useful field option, as there is no reason we can’t conduct our fixed duration performance trials at the end of a long ride, rather than when completely fresh. We could therefore build separate power profiles using tests performed when fresh, and using tests performed after a fixed duration of work (e.g. 2 hours at a fixed, moderate-intensity power output), and quantify durability as the difference between the two. This approach has actually been used in research with some success (2, 13). If you are considering using this approach, you will need to standardise what the ‘preload’ exercise is.
Conclusions
In summary, then, constructing a power profile may be a useful profiling tool when working with athletes, particularly those that do not have access to laboratory facilities for standard profiling assessments. We can use power profile data – as long as we collect it carefully – to estimate critical power, and therefore in training programming, training load monitoring, and deriving training zones; we may even be able to use the power profile to get a handle on ‘durability’.
EndureOn!
References
- Black MI, Jones AM, Blackwell JR, Bailey SJ, Wylie LJ, McDonagh STJ, Thompson C, Kelly J, Sumners P, Mileva KN, Bowtell JL, Vanhatalo A. Muscle metabolic and neuromuscular determinants of fatigue during cycling in different exercise intensity domains. J Appl Physiol 122: 446–459, 2017. doi: 10.1152/japplphysiol.00942.2016.
- Clark IE, Vanhatalo A, Bailey SJ, Wylie LJ, Kirby BS, Wilkins BW, Jones AM. Effects of two hours of heavy-intensity exercise on the power–duration relationship. Med Sci Sports Exerc 50: 1658–1668, 2018. doi: 10.1249/MSS.0000000000001601.
- Clark IE, Vanhatalo A, Thompson C, Joseph C, Black MI, Blackwell JR, Wylie LJ, Tan R, Bailey SJ, Wilkins BW, Kirby BS, Jones AM. Dynamics of the power-duration relationship during prolonged endurance exercise and influence of carbohydrate ingestion. J Appl Physiol 127: 726–736, 2019. doi: 10.1152/japplphysiol.00207.2019.
- Clark IE, Vanhatalo A, Thompson C, Wylie LJ, Bailey SJ, Kirby BS, Wilkins BW, Jones AM. Changes in the power-duration relationship following prolonged exercise: estimation using conventional and all-out protocols and relationship with muscle glycogen. Am J Physiol - Regul Integr Comp Physiol 317: R59–R67, 2019. doi: 10.1152/ajpregu.00031.2019.
- Galán-Rioja MÁ, González-Mohíno F, Poole DC, González-Ravé JM. Relative proximity of critical power and metabolic/ventilatory thresholds: Systematic review and meta-analysis. Sports Med 50: 1771–1783, 2020. doi: 10.1007/s40279-020-01314-8.
- Jones AM, Burnley M, Black MI, Poole DC, Vanhatalo A. The maximal metabolic steady state: redefining the ‘gold standard.’ Physiol Rep 7: 1–16, 2019. doi: 10.14814/phy2.14098.
- Jones AM, Wilkerson DP, DiMenna F, Fulford J, Poole DC. Muscle metabolic responses to exercise above and below the “critical power” assessed using 31P-MRS. Am J Physiol - Regul Integr Comp Physiol 294: R585–R593, 2008. doi: 10.1152/ajpregu.00731.2007.
- Karsten B, Hopker J, Jobson SA, Baker J, Petrigna L, Klose A, Beedie C. Comparison of inter-trial recovery times for the determination of critical power and W’ in cycling. J Sports Sci 35: 1420–1425, 2017. doi: 10.1080/02640414.2016.1215500.
- Leo P, Spragg J, Podlogar T, Lawley JS, Mujika I. Power profiling and the power-duration relationship in cycling: a narrative review. Eur J Appl Physiol 122: 301–316, 2022. doi: 10.1007/s00421-021-04833-y.
- Maunder E, Seiler S, Mildenhall MJ, Kilding AE, Plews DJ. The importance of ‘durability’ in the physiological profiling of endurance athletes. Sports Med 51: 1619–1628, 2021. doi: 10.1007/s40279-021-01459-0.
- Muniz-Pumares D, Karsten B, Triska C, Glaister M. Methodological approaches and related challenges associated with the determination of critical power and curvature constant. J Strength Cond Res 33: 584–596, 2019.
- Pethick J, Winter SL, Burnley M. Physiological evidence that the critical torque is a phase transition, not a threshold. Med Sci Sports Exerc 52: 2390–2401, 2020. doi: 10.1249/MSS.0000000000002389.
- Spragg J, Leo P, Swart J. The relationship between physiological characteristics and durability in male professional cyclists. Med Sci Sports Exerc Publish Ah: 133–140, 2022. doi: 10.1249/mss.0000000000003024.
- Stevenson JD, Kilding AE, Plews DJ, Maunder E. Prolonged cycling reduces power output at the moderate-to-heavy intensity transition. Eur J Appl Physiol 122: 2673–2682, 2022. doi: 10.1007/s00421-022-05036-9.
JOIN THE SQUAD
Take charge of your performance with proven training programs and workouts, adjustable to your needs, in the Endure IQ Training Squad.
LIMITED OFFER